
 Алгебра
 Английский
 Биология
 География
 Геометрия
 История
 Русский
 Обществознание
 Физика
 Химия
Химия Информатика
 Литература
 Математика
Вопрос:
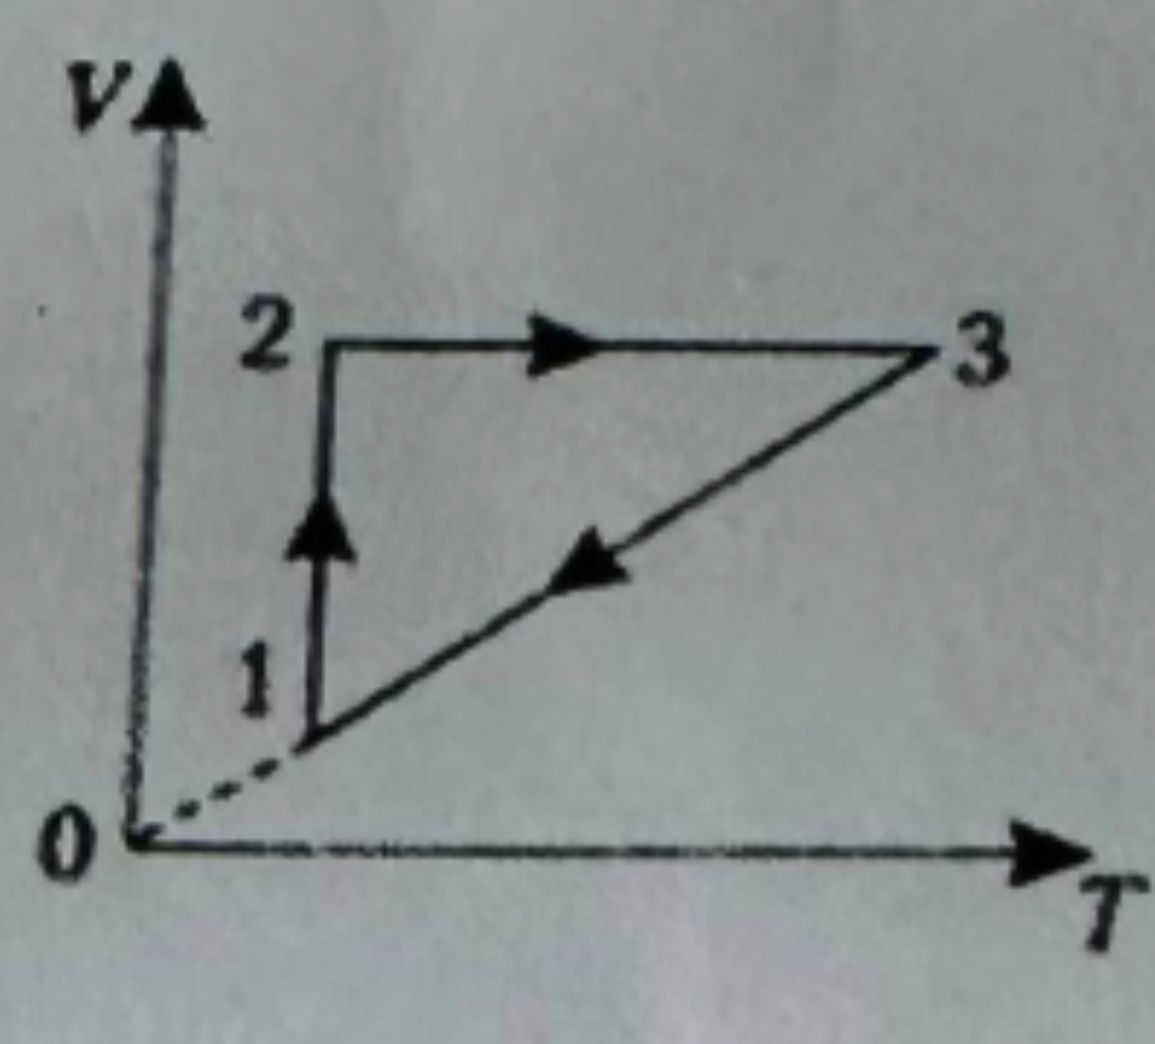
The image shows a V-T diagram representing a thermodynamic cycle. The cycle consists of three processes: 1-2, 2-3, and 3-1. Process 1-2 is an isochoric process where volume increases with temperature. Process 2-3 is an isobaric process where volume is constant and temperature increases. Process 3-1 is a process where volume decreases linearly with temperature, passing through the origin.
Ответ:
Analysis of the V-T Diagram
The provided image is a Volume-Temperature (V-T) diagram illustrating a thermodynamic cycle with three distinct processes labeled 1, 2, and 3.
Process 1-2:
- This process is represented by a vertical line segment pointing upwards.
- On a V-T diagram, a vertical line indicates that the temperature (T) is constant, while the volume (V) changes. However, the arrow indicates an increase in V with a constant T (if we consider T as the independent variable on the x-axis, which is typically the case). Given that the V axis is vertical and the T axis is horizontal, this segment represents an isochoric process where the volume is constant, and the temperature increases. The arrow shows an increase in V as T increases. Looking closely at the diagram, the arrow points from a lower V to a higher V, while the T coordinate appears to be constant for this segment. There's a label '1' near the beginning of this arrow and '2' at the end. The arrow direction signifies V increasing from state 1 to state 2. The x-axis is T, and the y-axis is V. Therefore, for process 1-2, T is constant and V increases. This is an isobaric process. The arrow indicates an increase in V. Let's re-evaluate. If the x-axis is T and y-axis is V, then a vertical line means T is constant and V changes. The arrow goes up, so V increases. Thus, this is an isobaric process. However, the label '1' and '2' are on the V axis for this segment. Let's assume the points are labeled. Point 1 is at some initial V and T. Point 2 is at a higher V and the same T. So, T is constant, and V increases. This is an isobaric process.
- Let's re-interpret based on standard V-T diagrams. The x-axis is T, and the y-axis is V. Process 1-2 is a vertical line segment. This means T is constant, and V increases. So, it is an isobaric process. The label '1' and '2' are points on the V-axis for this segment. Let's assume the points are labeled 1 and 2. So, from state 1 to state 2, V increases while T is constant. This is an isobaric process.
- Looking at the visual representation, the arrow for process 1-2 goes upwards along the V-axis, implying an increase in Volume (V) while Temperature (T) remains constant. This is characteristic of an isobaric process.
Process 2-3:
- This process is represented by a horizontal line segment pointing to the right.
- On a V-T diagram, a horizontal line indicates that the volume (V) is constant, while the temperature (T) changes. The arrow indicates an increase in T.
- Thus, process 2-3 is an isochoric process (constant volume). The arrow signifies that temperature increases from state 2 to state 3.
Process 3-1:
- This process is represented by a diagonal line segment pointing downwards and to the left, originating from point 3 and ending at point 1 (which is close to the origin). The dashed line from the origin (0) to point 1 suggests that state 1 might be at T=0, or that the relationship is proportional from the origin. The line passes through the origin.
- The line segment 3-1 shows a decrease in both Volume (V) and Temperature (T) as the process moves from state 3 to state 1. Since the line passes through the origin (0), it implies that V is directly proportional to T (V = cT), where 'c' is a constant. This is characteristic of an isobaric process.
- The arrow indicates a decrease in both V and T from state 3 to state 1.
Summary of Processes:
- 1-2: Isobaric process (Constant pressure), where Volume increases.
- 2-3: Isochoric process (Constant volume), where Temperature increases.
- 3-1: Isochoric process (Constant volume), where Temperature decreases.
Correction based on visual interpretation:
Re-examining the diagram: The axes are labeled V (vertical) and T (horizontal).
- 1-2: The line is vertical. This means T is constant, and V increases. This is an isobaric process.
- 2-3: The line is horizontal. This means V is constant, and T increases. This is an isochoric process.
- 3-1: The line is diagonal and passes through the origin (indicated by the dashed line). This means V is directly proportional to T (V/T = constant). This is an isobaric process. However, the slope here is V/T. For an isobaric process, P is constant. For an isochoric process, V is constant. For an isothermal process, T is constant. The relation V/T = constant is characteristic of an isochoric process if T changes along the path. Let's consider the ideal gas law PV = nRT.
Let's assume the labels 1, 2, and 3 represent states.
- Process 1 $$\rightarrow$$ 2: V increases, T is constant. This is an isobaric process.
- Process 2 $$\rightarrow$$ 3: V is constant, T increases. This is an isochoric process.
- Process 3 $$\rightarrow$$ 1: V/T = constant (since the line passes through the origin). This implies V is proportional to T. This is an isochoric process. Wait, if V/T is constant, then PV = nRT implies P = nR, which means pressure is constant. So, 3-1 is an isobaric process.
Let's try to be precise with the labels.
- Process 1 $$\rightarrow$$ 2: Vertical line on V-T graph. T is constant, V increases. This is an isobaric process.
- Process 2 $$\rightarrow$$ 3: Horizontal line on V-T graph. V is constant, T increases. This is an isochoric process.
- Process 3 $$\rightarrow$$ 1: Line passing through the origin. V/T = constant. This means P = nRT/V = nR / (V/T) = nR / constant. So, P is constant. This is an isobaric process.
Reconsidering the definition of the processes on a V-T diagram:
- Isobaric process: Constant pressure (P = constant). From ideal gas law, V/T = nR/P = constant. So, on a V-T diagram, an isobaric process is a straight line passing through the origin.
- Isochoric process: Constant volume (V = constant). On a V-T diagram, an isochoric process is a vertical line.
- Isothermal process: Constant temperature (T = constant). On a V-T diagram, an isothermal process is a curve where V decreases as T increases (or vice-versa). PV = constant implies V = constant/T.
Applying these definitions to the given V-T diagram:
- Process 1 $$\rightarrow$$ 2: This is a vertical line. Thus, V is constant. This is an isochoric process. The temperature increases from state 1 to state 2.
- Process 2 $$\rightarrow$$ 3: This is a horizontal line. Thus, T is constant. This is an isothermal process. The volume increases from state 2 to state 3.
- Process 3 $$\rightarrow$$ 1: This is a straight line passing through the origin. Thus, V/T is constant. This implies P is constant. This is an isobaric process. The volume and temperature both decrease from state 3 to state 1.
Final Conclusion based on standard definitions:
- 1 $$\rightarrow$$ 2: Isochoric process (Volume constant, Temperature increases)
- 2 $$\rightarrow$$ 3: Isothermal process (Temperature constant, Volume increases)
- 3 $$\rightarrow$$ 1: Isobaric process (Pressure constant, Volume and Temperature decrease along V/T = constant line)
