
 Алгебра
 Английский
 Биология
 География
 Геометрия
 История
 Русский
 Обществознание
 Физика
 Химия
Химия Информатика
 Литература
 Математика
Вопрос:
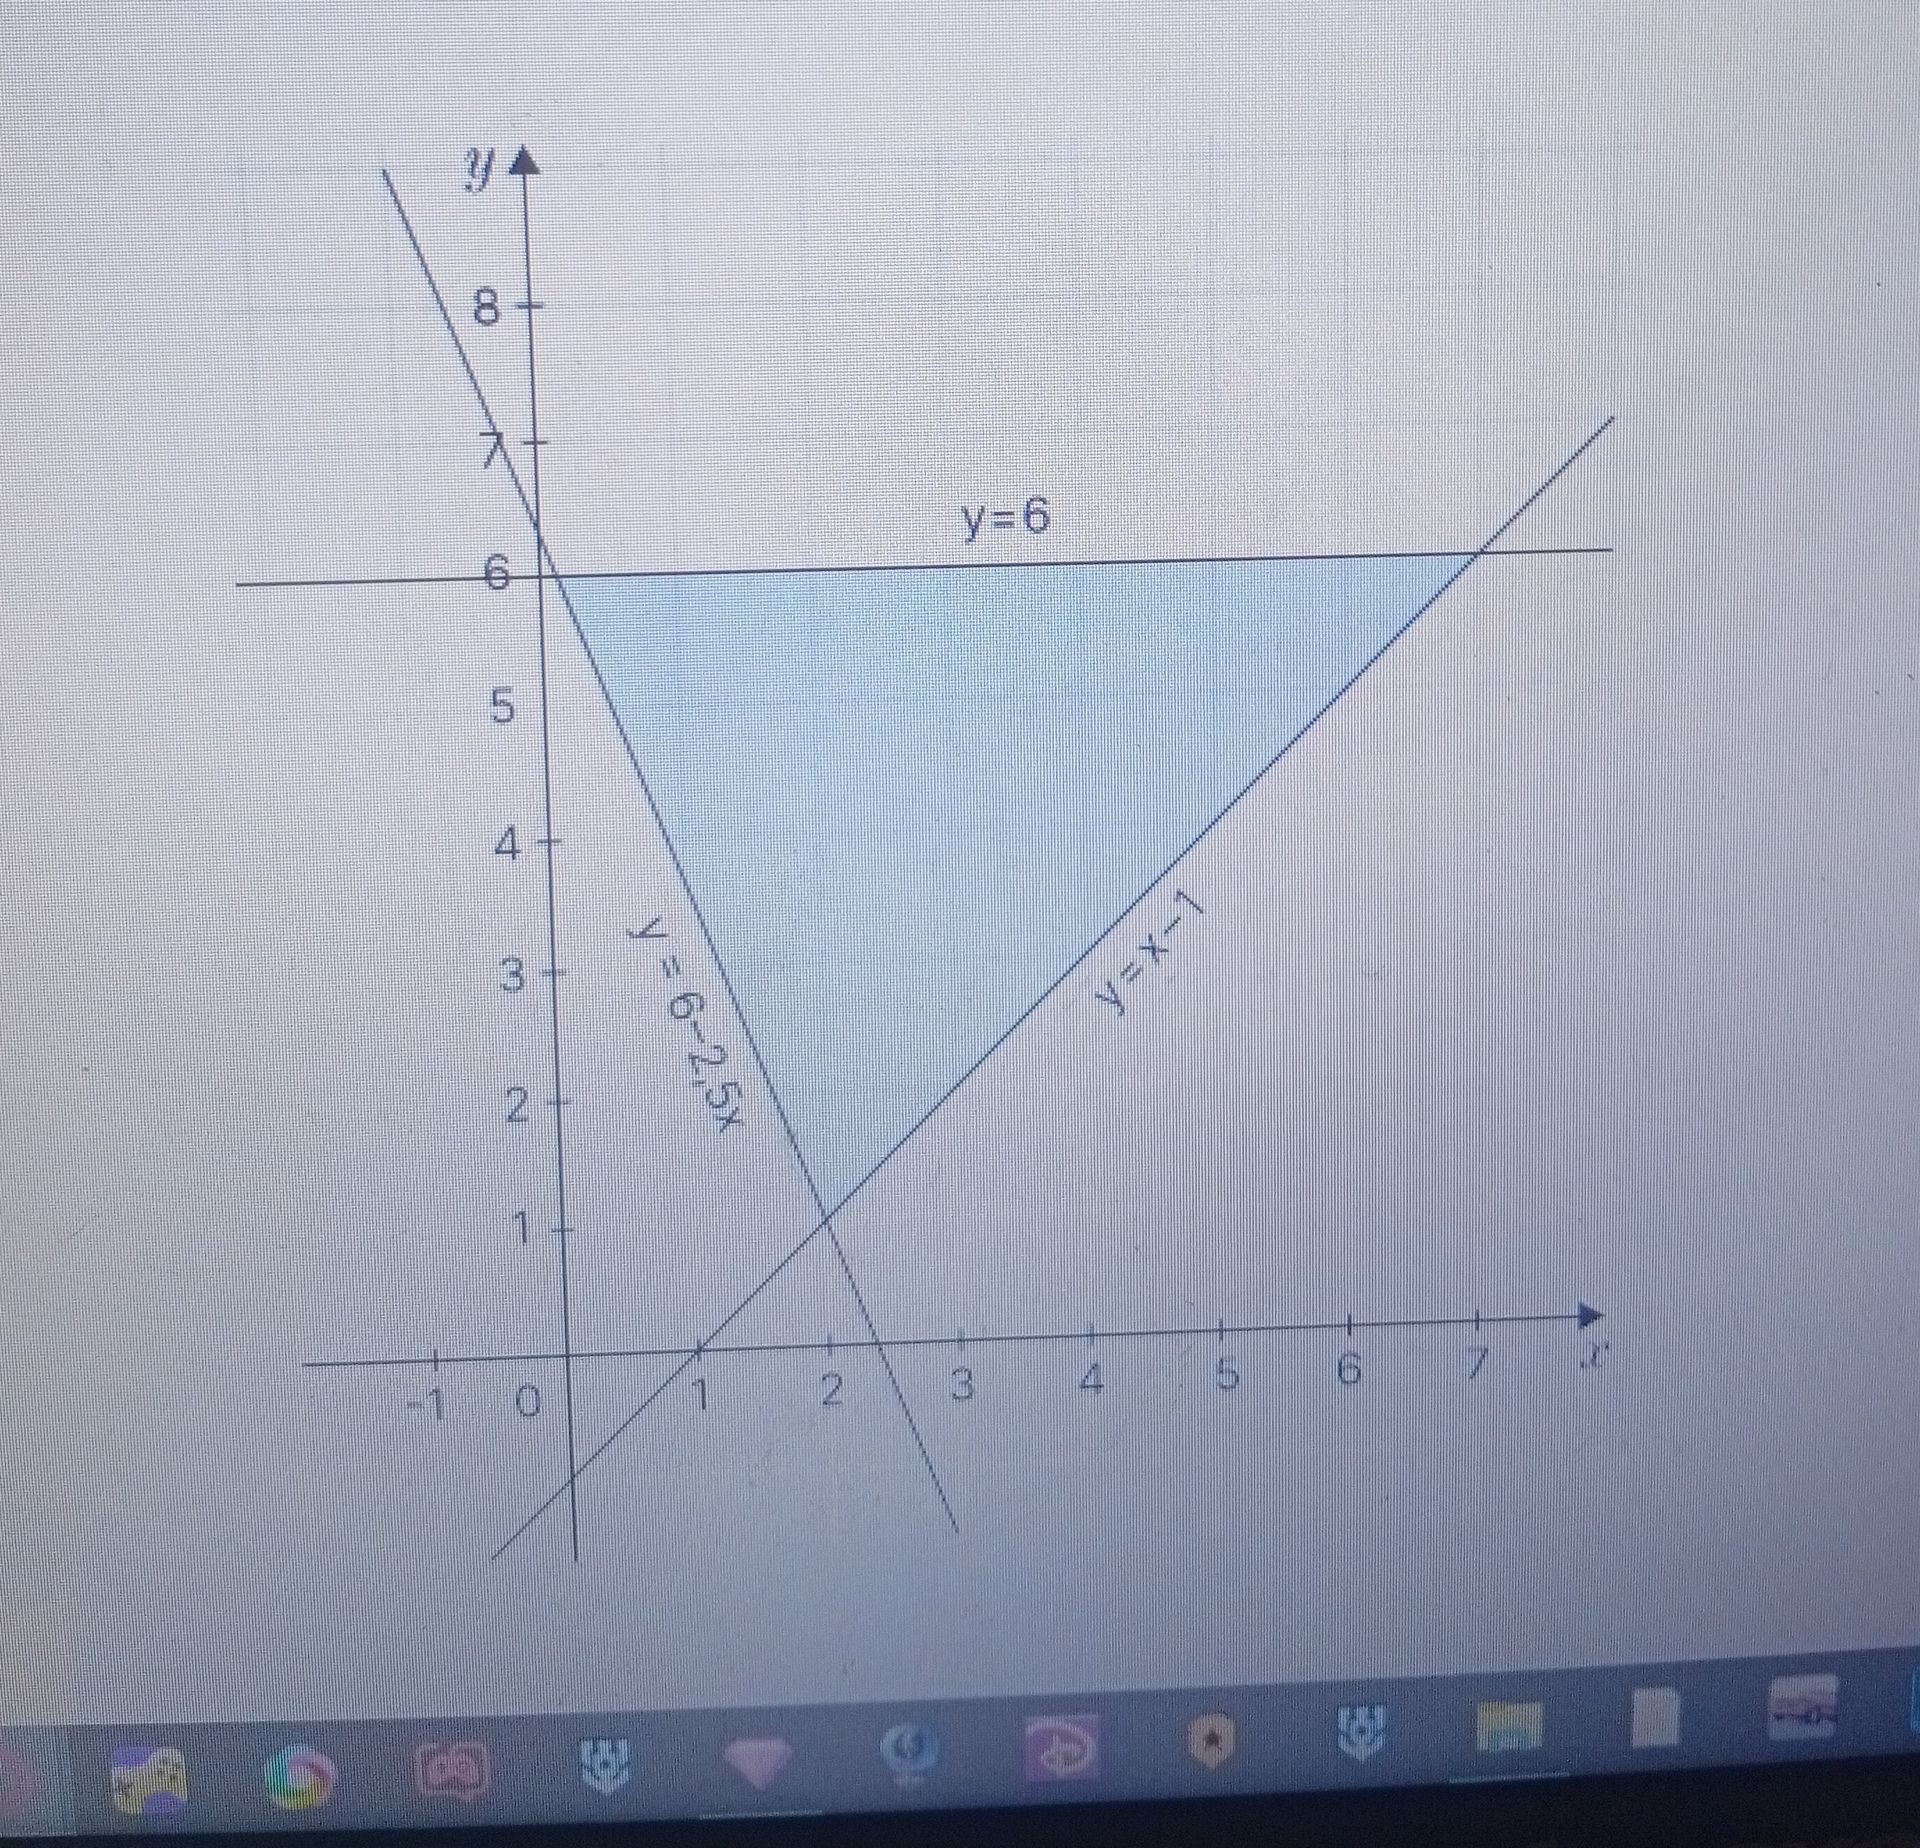
The image displays a graph with three lines and a shaded region. The lines are represented by the equations: 1. y = 6 2. y = 6 - 2.5x 3. y = x - 1 The shaded region is a triangle. The task is to analyze the provided image and extract relevant information. Specifically, identify the equations of the lines and describe the shaded region.
Ответ:
Analysis of the Graph:
The image shows a Cartesian coordinate system with three lines and a shaded triangular region.
The equations of the lines are:
- The horizontal line is labeled as y = 6.
- The line sloping downwards from left to right is labeled as y = 6 - 2.5x.
- The line sloping upwards from left to right is labeled as y = x - 1.
The shaded region is a triangle formed by the intersection of these three lines. The vertices of the triangle can be found by solving the systems of equations for each pair of intersecting lines.
