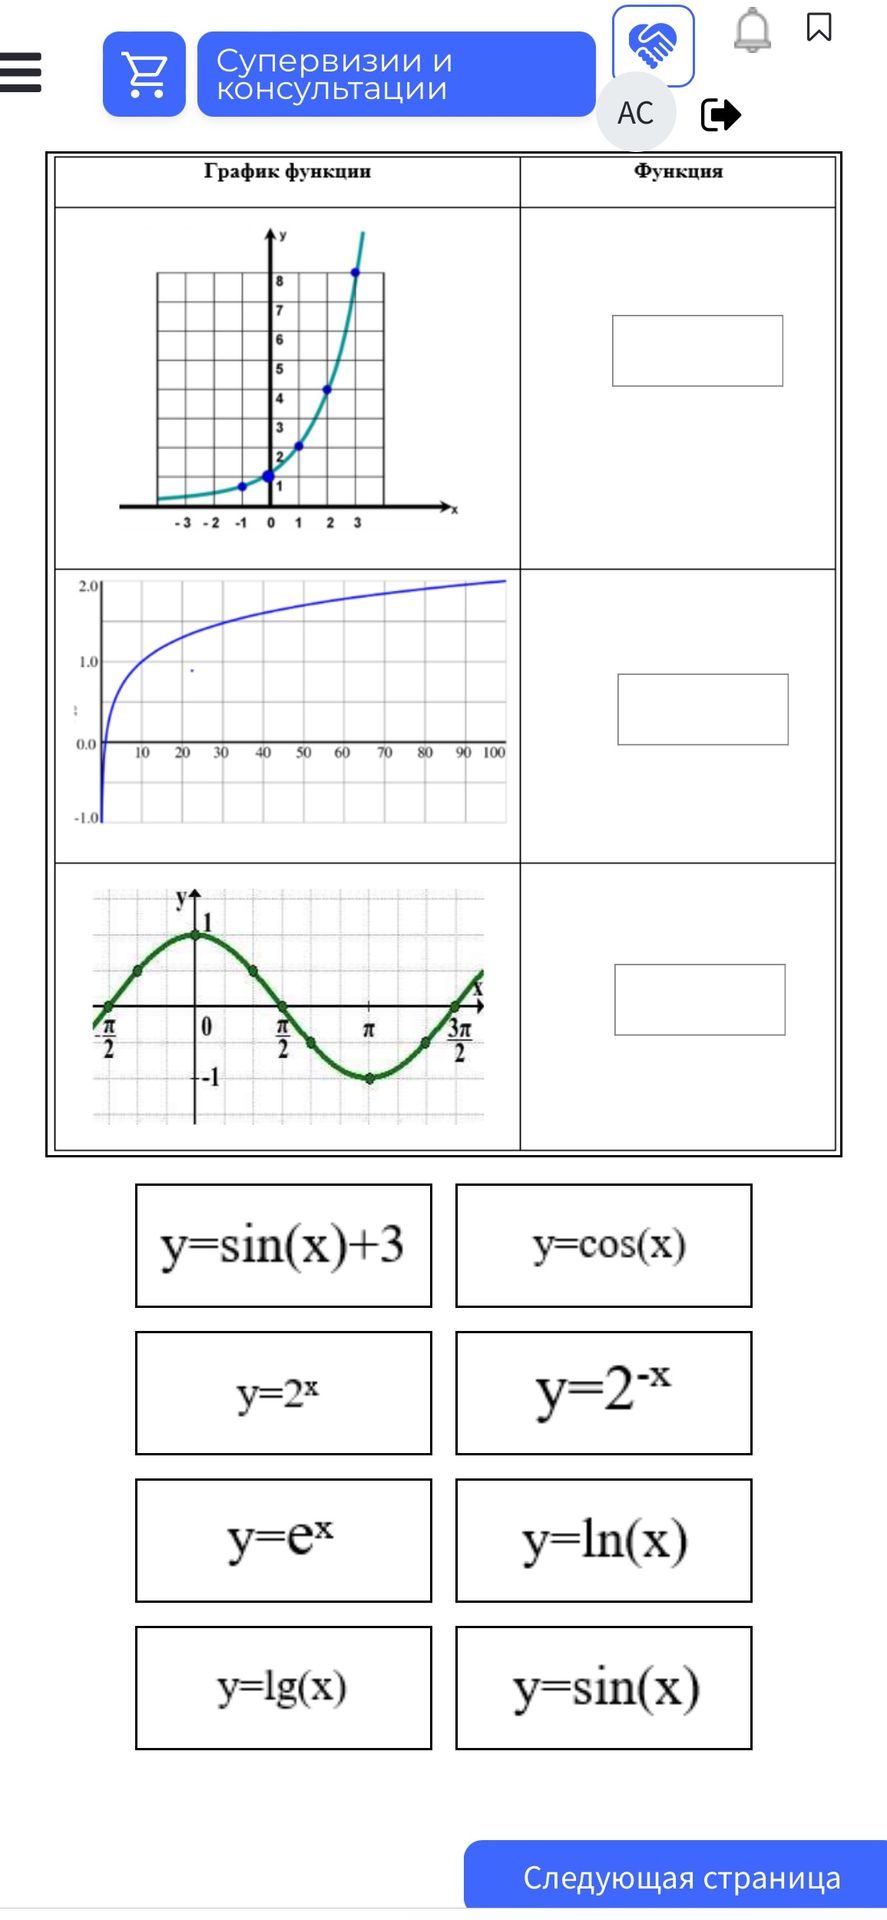
Match the graphs with their corresponding functions.
Ответ:
Solution:
We need to match the given graphs with the functions provided. Let's analyze each graph and function:
Graph 1:
The graph shows an exponential growth function. It passes through points like (0,1), (1,2), (2,4), (3,8). This suggests a function of the form \( y = a^x \) or \( y = a^x + c \). Since it passes through (0,1), \( c = 0 \) and \( a = 2 \). Therefore, the function is \( y = 2^x \).
Graph 2:
The graph shows a logarithmic function. The y-values are increasing slowly as x increases. It seems to be the inverse of an exponential function. If we consider \( y = \textrm{log}_b(x) \) or \( y = \textrm{ln}(x) \) or \( y = \textrm{lg}(x) \). Observing the values, when \( x=1 \), \( y=0 \). When \( x=10 \), \( y=1 \). When \( x=100 \), \( y=2 \). This is characteristic of the common logarithm \( y = \textrm{lg}(x) \).
Graph 3:
The graph shows a periodic wave function. It passes through \( (0,0) \), \( (\frac{\pi}{2}, 1) \), \( (\pi, 0) \), \( (-\frac{\pi}{2}, -1) \). This is the standard sine wave, \( y = \textrm{sin}(x) \).
Function Options:
- \( y = \textrm{sin}(x)+3 \)
- \( y = \textrm{cos}(x) \)
- \( y = 2^x \)
- \( y = 2^{-x} \)
- \( y = e^x \)
- \( y = \textrm{ln}(x) \)
- \( y = \textrm{lg}(x) \)
- \( y = \textrm{sin}(x) \)
Matching:
- Graph 1 matches with \( y = 2^x \).
- Graph 2 matches with \( y = \textrm{lg}(x) \).
- Graph 3 matches with \( y = \textrm{sin}(x) \).
The functions \( y = \textrm{sin}(x)+3 \), \( y = \textrm{cos}(x) \), \( y = 2^{-x} \), \( y = e^x \), \( y = \textrm{ln}(x) \) are not represented by the displayed graphs.
Final Matches:
- Graph 1: \( y = 2^x \)
- Graph 2: \( y = \textrm{lg}(x) \)
- Graph 3: \( y = \textrm{sin}(x) \)
